🚀 I built my very first Data Engineering Pipeline!

This project is an ETL pipeline that scrapes trending GitHub repositories, processes the data, stores it in a database, and visualizes it in a Streamlit app. You can see the project here: https://github.com/kburla/github_trending.
Here are the tools that I used for this pipeline, and a rundown of what the application does.
Implementation
Tools
Python
SQLite
SQLAlchemy
Apache Airflow
Streamlit
Extract
A scraper.py script scrapes the Github Trending page https://github.com/trending for each time span (Today, This Week, This Month). The scraper uses requests and BeautifulSoup to scrape key details for each trending repository:
Name
Description
Programming Language
Stars
Forks
URL
The date it appeared on the list
Transform
The raw data is then cleaned:
Ensuring proper data types
Handling missing values by setting them to defaults or None
Formatting categorical values if necessary
Load
Since I wanted historical tracking, I decided to store the data in a SQLite database. Instead of overwriting records, I saved a new row every time the scraper ran. This way, I could look back and see how a project’s popularity evolved over time.
Automation
It wouldn’t be a proper data engineering pipeline if we didn’t automate this process on a schedule. Enter Apache Airflow. I wrote a DAG (Directed Acyclic Graph) that schedules the scraper to run every hour, capturing snapshots of trending repos over time.
Visualization
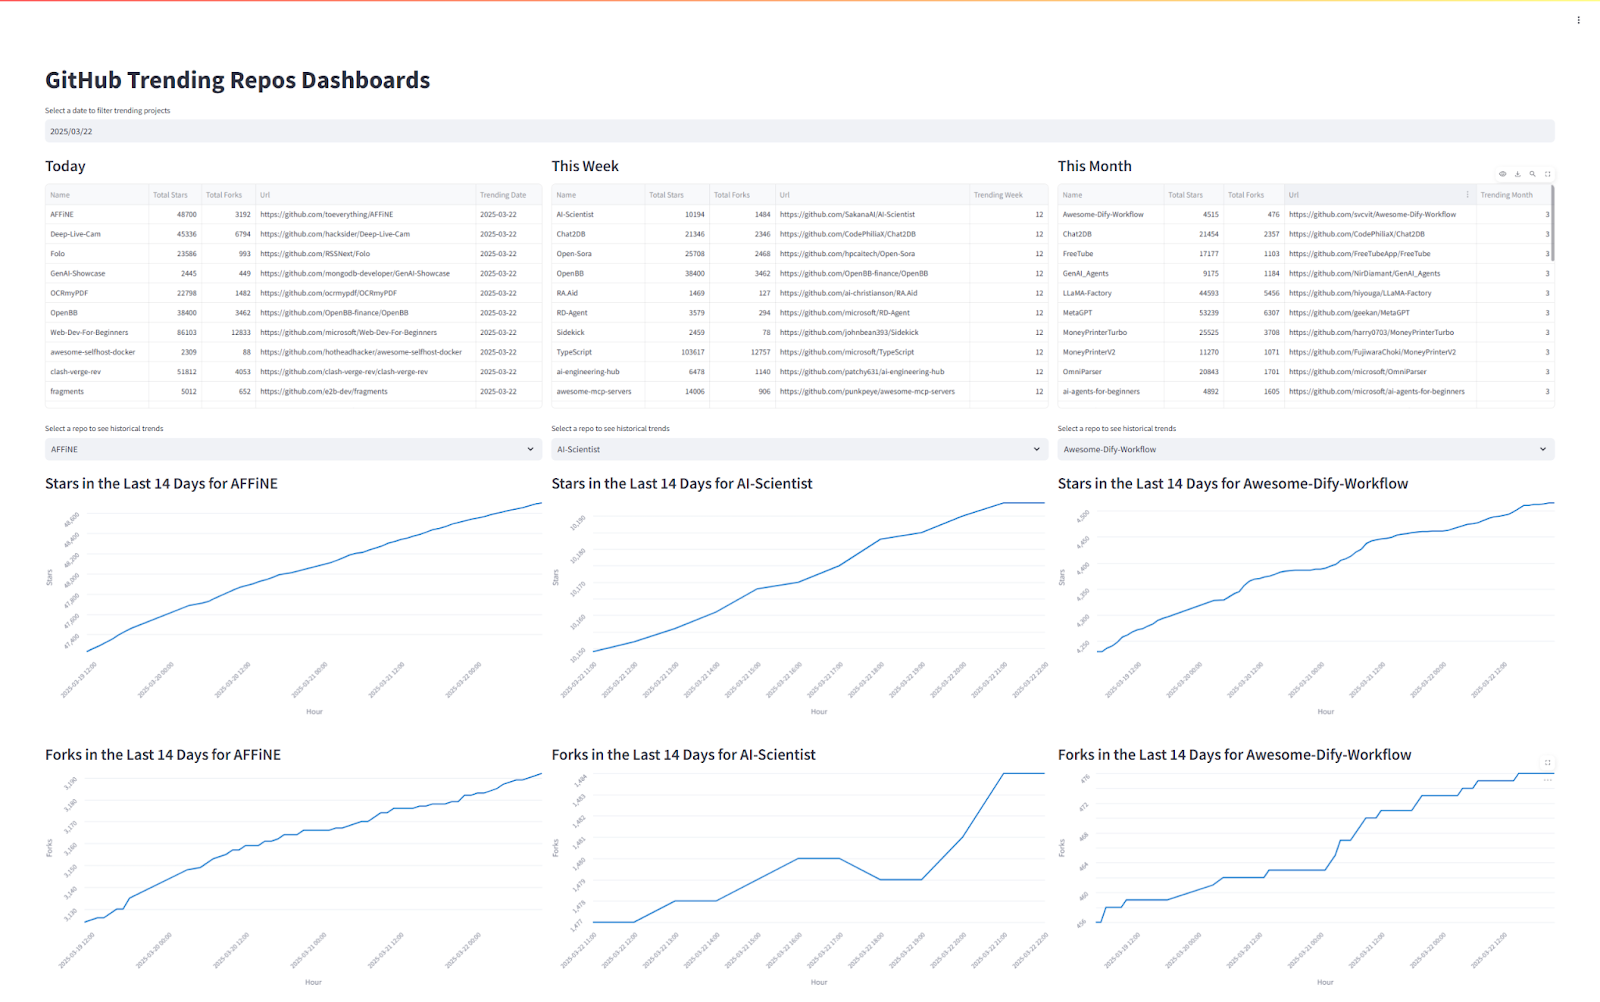
I wanted to actually see my data so I built a Streamlit app to visualize it. I wanted something interactive, so I added:
A date picker to view past trends.
Three columns (Today, This Week, This Month) to compare trends.
Time-series charts tracking stars and forks over the last 14 days for any repo.
Problems and Solutions
1. Data Storage & Granularity
At first, I stored only one row per repo, updating it when the stars/forks changed. This meant that if I scraped at different times of the day, I might see different numbers so when and how often should I run the script? To get more granular tracking, I switched to storing a new row every time the script runs, whether or not the repo already exists in the database. This way, I capture trends over time, not just point-in-time snapshots.
2. Optimizing Storage & Gaps in Tracking
While storing every snapshot was helpful, it also introduced data redundancy. To fix this, the next step is to split the data into two tables:
Repository Table: Stores unchanging details like repo name, description, URL.
Time-Series Table: Stores only the dynamic data (stars, forks, timestamp).
This will deduplicate information and make queries more efficient.
Since I only track repos while they’re trending, when a repo drops off the trending list, I stop getting updates. This causes gaps in the time-series charts.
A potential fix is to scrape each repo’s page directly, in addition to just relying on the trending list. I could use Github’s public API for this. This way, I can continue tracking a repo’s popularity even after it stops trending.
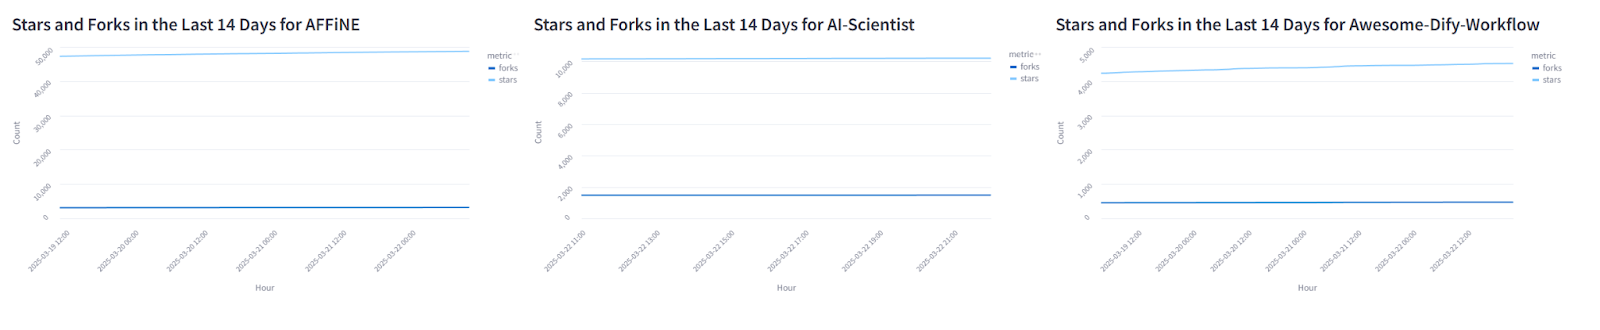
3. Visualization Issues
Initially, I plotted stars and forks on the same graph, but because stars are often an order of magnitude larger, the stars’ and forks’ growth became almost invisible. I imagine there may be a better way to show this, but for now I just separated them into 2 charts. To have the scale actually reflect the growth, I used the min and max number of forks and stars as my y-axis limits, but I could probably refine this by showing a slightly more standardized scale.
Use Cases
This pipeline can have several use cases.
Spot emerging trends: Developers, startups, and investors can catch promising projects before they blow up.
Market research: VCs can analyze which technologies are gaining traction to make smarter investment decisions.
Personalized recommendations: a system that suggests trending repositories based on your GitHub activity.
Recruitment insights: Tech companies can identify active contributors and rising stars in the dev community.
Competitive analysis: Companies can track how competitors’ projects are performing.
and so much more…
What’s Next?
Tracking repos beyond the trending list to fill in the missing time-series data.
Split the data into two tables: one for unchanging repo info (name, description, URL) and another for time-series data (stars, forks, timestamps) to reduce duplication.
Building a more advanced dashboard with filtering, sorting, and deeper analytics.
Publish this application to the web to be publicly accessible
Exploring new data sources beyond GitHub for a broader picture of tech trends.